Monitoring
Tools for monitoring the Tamr Core platform. This topic is useful for single-node on-premises deployments.
Tamr Core supports the following systems monitoring and alerting tools.
- Kibana
- Grafana
- Prometheus
- Elasticsearch Exporter
- Prometheus Node Exporter
- PostgreSQL Exporter
- Spark Exporter (via Graphite)
Important: Kibana and Grafana are disabled by default. You enable them by setting the related Tamr Core configuration variables as follows:
TAMR_ELK_ENABLED=trueandTAMR_GRAFANA_ENABLED=true. See the Configuration Variable Reference.
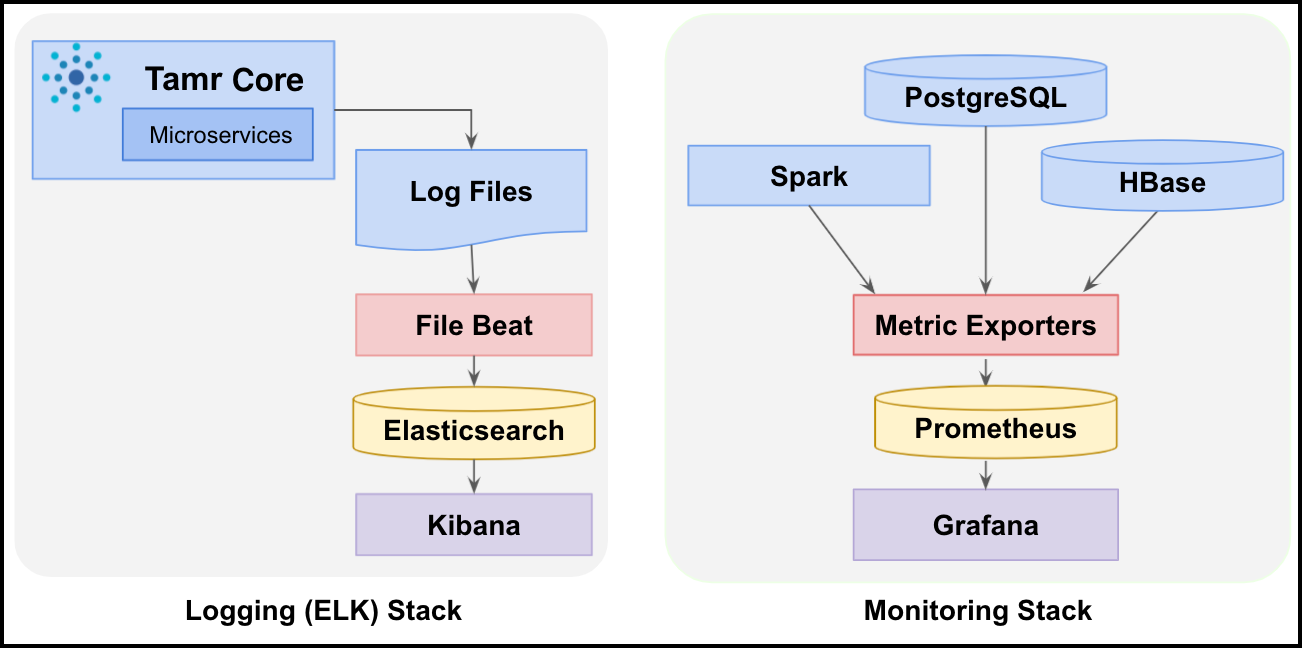
The following system diagrams show the tools that monitor and log data for metrics.

Tamr Core logging (left) and monitoring (right) stacks.
These diagrams use the following colors to identify components:
- Blue: Tamr Core and its microservices
- Red: Extraction layer
- Yellow: Storage
- Purple: the user interface
Before getting started with these components, review the prerequisites.
Supported Monitoring and Alerting Packages
The Tamr Core software package, unify.zip, includes the following systems monitoring and alerting packages. These packages are optional; use them only if you would like to configure monitoring and alerting with Tamr Core.
| Package | Version |
|---|---|
| Grafana | 6.3.4 |
| Kibana | 5.6.16 |
| ElasticSearch (provides logging information for Kibana) | 5.6.3 |
| Prometheus | 1.5.2 |
| Prometheus Node Exporter | 0.14.0 |
| HBase Exporter (provides information for Prometheus) | 0.0.1 |
| ElasticSearch Exporter (provides information for Prometheus) | 0.3.3 |
| PostgreSQL Exporter (provides information for Prometheus) | 0.2.3 |
| Graphite Exporter (provides Spark information for Prometheus) | 0.2.0 |
Tip: You configure HBase Exporter separately from the other metric exporters in the monitoring stack.
Prerequisites
Before You Begin:
- Verify that Tamr Core is installed. See Installation.
- Verify that you have enabled Kibana and Grafana, which are disabled by default. To enable them, set the following variables to
true:TAMR_ELK_ENABLEDandTAMR_GRAFANA_ENABLED. See Configuration Variables. - Verify that the Grafana port is open and accessible for inbound web traffic. The default port number is
31101. - Verify that the Kibana port is open and accessible for inbound web traffic. The default port number is
5601.
Kibana
Kibana is an open source data visualization plugin for Elasticsearch. It allows you to search and analyze Elasticsearch log messages and time series data. Kibana is included in the Tamr Core package and, if you enable it, is available at port 5601.
To use Kibana for Tamr Core Elasticsearch logs:
- Confirm the prerequisites are complete, and that
TAMR_ELK_ENABLED=true. See Configuration Variables. - In a browser, navigate to the default Kibana port
5601.
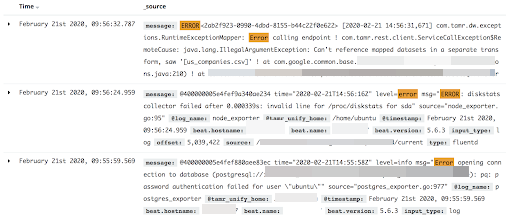
The following screenshot illustrates searching Tamr Core logs in Kibana:

Kibana logs show errors.
Grafana
Grafana allows you to query, visualize, alert on, and understand metrics stored in Prometheus.
To use Grafana for Tamr Core logs:
- Confirm the prerequisites are complete, and that
TAMR_GRAFANA_ENABLED=true. See Configuration Variables. - Open the default Grafana port
31101and log into Grafana using the administrator credentials.
Prometheus
Prometheus stores time series data for a specific metric and provides a query language that allows you to select and aggregate metrics in real time.
For more information, see the list of metrics that help you measure the behavior of critical components in your production environment.
Monitoring on Cloud Platforms
- For AWS, see Deploying Tamr Core on AWS.
- For Azure, see Deploying Tamr Core on Azure.
- For GCP, see Deploying Tamr Core on Google Cloud Platform.
Updated over 2 years ago