Working with Geospatial Data
You can work with geospatial data in mastering projects to deduplicate data. Tamr Core offers transformation functions and similarity metrics specifically for geospatial data.
Important: Support for geospatial features is in limited release. Currently, only mastering projects consider geospatial data in machine learning and provide visualizations of geospatial data.
Geospatial features may present a different performance and stability profile compared with other Tamr Core features. While adding geospatial data to Tamr Core is possible with internal APIs, Tamr recommends use of the Tamr Python Client.
Golden records and the preview in transformations are not supported for datasets containing geospatial data. For other limitations on the current feature set, see Known Limitations on Geospatial Features.
Adding Datasets with Geospatial Data
To load geospatial data, use the Tamr Python Client or contact Tamr Support at help@tamr.com. By importing datasets with the Tamr Python client or through internal APIs, Tamr Core parses source geometry attributes and creates attributes with geospatial data types.
What Can You Do with Geospatial Data?
After adding datasets with geospatial data, you can:
- Configure Tamr Core to use an OSM or WMTS tile server. Be aware that public servers such as Openstreet Map and ThunderForest require that you abide by their terms of use. You can then view geospatial record pairs, clusters, and shapes, such as polygons, on the Leaflet-based map. See Configuring Geospatial Map Tiles.
- Use a Leaflet-based map on the Pairs and Clusters pages. If you configure two or more tile servers, you can switch between them and use different maps for pair matching and clustering. You can zoom and pan on the map to refetch geospatial data as the map adjusts interactively. See Selecting a Tile Server.
- Label pairs of records or groups that contain geospatial data as match or no match. On the Schema Mapping page, you can configure pair similarity metrics, such as Hausdorff, Relative Hausdorff, and Directional Hausdorff Distances. You can then view pairs on the map, along with their similarity metrics and location. See Similarity Metrics for Geospatial Data.
- Cluster records based on features extracted from geospatial data to eliminate duplicates. On the Clusters page, view a cluster of records on the map, and configure Tamr Core to display records that are adjacent to a specific cluster of geospatial records. See Working with Pairs and Clusters of Geospatial Records.
- Use geospatial records in unified datasets.
- Align records containing geospatial data with existing taxonomies.
- Run geospatial-boundary searches on clusters of geospatial records.
Transformations for Geospatial Data
Run geospatial transformations on input records, such as constructing geospatial data types from latitude and longitude coordinates or computing the area of an object. For information, see GIS Functions.
Record Grouping for Geospatial Data
For projects with the record grouping feature enabled, select the Custom aggregation function for geospatial attributes that are not defined as grouping keys.
Geospatial Data Formats
The Tamr Python Client and internal APIs allow you to work with geospatial attributes represented as GeoJSON (RFC7946).
Important: Per RFC7946, follow the right-hand rule when specifying the orientation for polygons and multi-polygons in order for them to display.
Similarly, you can export data from Tamr Core in the GeoJSON format. See Geospatial Data Types.
Tamr Core uses 64-bit double-precision floating-point format for its calculations on geospatial data.
Geospatial Coordinate Systems
Tamr Core supports the WGS84 coordinate system. If the input data uses another coordinate system, such as Universal Transverse Mercator (UTM), convert it to WGS84 before uploading it into a project.
Similarity Metrics for Geospatial Data
You can use similarity metrics on geospatial data. These metrics help you determine whether a pair of geographic objects represents the same real world entity.
Several of the metrics rely on the concept of Hausdorff distance. Hausdorff distance is the maximum distance from a set to the nearest point in the other set. The closer two geometric objects are based on the Hausdorff distance, the more likely it is that they are similar, both in shape and in location.
When creating a blocking model that includes geospatial type attributes, you can select these similarity metrics:
- Directional Hausdorff
- (Undirectional) Hausdorff Distance
- Relative Hausdorff
- Relative Area Overlap
- Min Distance
Directional Hausdorff
The max-min distance, in meters, from an object A to an object B is the greatest of all the distances from each point on the boundary of A to its closest point on the boundary of B. Directional Hausdorff similarity metric between two objects A and B is the minimum of max-min distance between A and B, and the max-min distance between B and A. This similarity function is symmetrical (that is, the similarity between A and B is equal to the similarity between B and A).
This similarity function is useful for checking part-of-object matching, such as partial overlap of boundaries. For example, you can use this metric to see if a small section of a road matches against the entire road, or whether a smaller building shares its boundaries with some part of the boundaries of another, larger building.
Hausdorff Distance
Hausdorff distance (or unidirectional Hausdorff distance) measures how far two objects are away from each other within a metric space. This metric represents the absolute Hausdorff distance in meters between two geometric objects. The Hausdorff distance is the maximum of the max-min distance between A and B, and the max-min distance between B and A. This similarity function is symmetrical (that is, the similarity between A and B is equal to the similarity between B and A). Hausdorff distances on polygons are always boundary to boundary.
This function is useful for matching buildings and roads.
Relative Hausdorff
This similarity metric represents the degree of similarity between two objects. It is computed by dividing the standard Hausdorff distance from A to B by the diameter of the smaller of the two objects (A or B). This quotient is subtracted from 1 to get the relative Hausdorff distance.

The formula for computing relative Hausdorff distance.
The relative Hausdorff distance is bounded by 0 and 1.0, so if the resulting number is less than 0, the relative Hausdorff distance is set to 0.
This metric is useful when you need to determine possible similarity between two geographic objects that have different scale or sizes, such as small or large buildings, or a mixture of cities, rivers, buildings, and so on. Relative Hausdorff uses true shape diameter for its calculations. Identical objects, such as objects of the same size that completely overlap, have the relative Hausdorff value equal to 1.0. Use Relative Hausdorff for attributes of type lineString and polygon.
Note: Do not use the relative Hausdorff distance for attributes with the point geospatial data type.
Relative Area Overlap
The relative area overlap for two geospatial features is computed as the area of their intersection over the area of the larger object. The range is [0, 1]. This similarity function is useful for polygons and multi-polygons, including polygons with holes.
Unlike Hausdorff signals, this signal takes the areas of the geospatial features into account, rather than only their boundaries. For example, if you have a small shape contained entirely in a large object and close to its center, boundary-based matching does not return a high score. In cases like this, using relative area overlap takes the actual area intersection into account.
Tip: This metric is always 0 for points and line segments.
Min Distance
This non-Hausdorff similarity function is computed as the minimum distance between all pairwise points on the boundaries of two features. The range is [0, infinity]. Mathematically, this is min-min distance, while for comparison, the Hausdorff distance is max-min distance. As a result, this function is useful for objects that are close, but not necessarily intersecting.
This function can be used for points, line strings, and polygons, as well as the multi versions of these data types, to get the distance between the closest points on two shapes.
Specifying a Geospatial Similarity Metric
You identify unified attributes as geospatial attributes and specify similarity metrics for them during the schema mapping process for your mastering project.
Important: You can only make changes to the Geospatial Attribute setting for an attribute from the time you add it until Update unified dataset runs for the project. Deleting an attribute and adding one with the same name is not a valid workaround for this limitation. For best results, identify an attribute as geospatial immediately after you add it and then do not change this setting.
Tip: When starting a new mastering project you might create multiple copies of a geometry attribute and specify a different similarity metric for each one to help discover which is more useful for mastering your data. However, the project only displays maps for the first geospatial attribute it finds.
To specify the geospatial similarity metric for an attribute:
- Open the Schema Mapping page and add the unified attribute that you want to identify as geospatial. When schema mapping and transformations are complete, this attribute must have values that represent its geographic coordinates, and be one of the supported Geospatial Data Types.
If you have more than one such attribute, consider mapping them to a single unified attribute and designating only that attribute as geospatial. As noted in the tip above, the mastering project only displays record comparison maps for the first geospatial attribute it finds. - On the right side of the screen, select More
 to open the properties for this attribute.
 - To mark the attribute as geospatial, choose Advanced and then activate the Geospatial Attribute toggle. The Similarity function list updates to include the geospatial similarity metrics.
- Select one of the metrics for geospatial data.
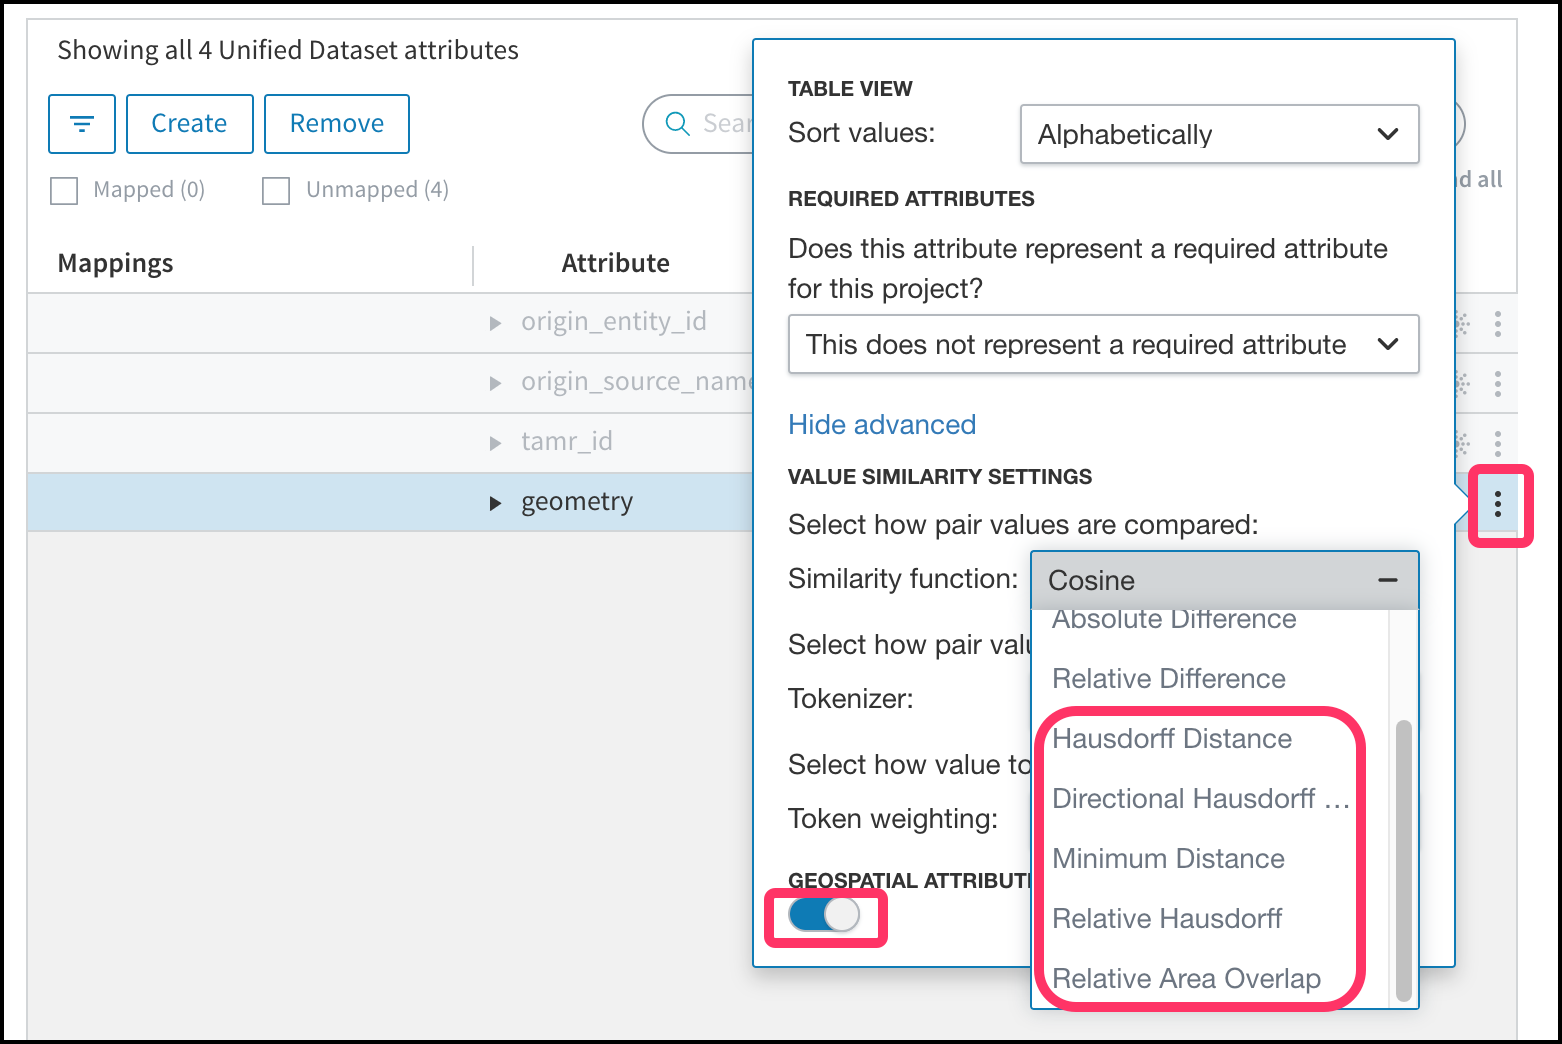
Identify an attribute as a geospatial attribute and specify its similarity metric.
- To close the properties popup, select More
 again.
After you specify the metric to use, you can proceed with schema mapping and mastering. The mastering project generates pairs with similarity satisfying a specified threshold.
Important: You can only make changes to the Geospatial Attribute setting for an attribute from the time you add it until Update unified dataset runs for the project. Deleting an attribute and adding one with the same name is not a valid workaround for this limitation. For best results, identify an attribute as geospatial immediately after you add it and then do not change this setting.
Configuring Geospatial Map Tiles
Tamr Core works with the following tile servers:
For information about the terms of use for these services, contact the respective hosts.
To configure a tile server:
- Create a YAML file based on the following example.
- Add this file using
<tamr-home-directory>/tamr/utils/unify-admin.sh config:set --file <path-to-file>/my-config.yaml.
See Setting configuration variables.
When creating the YAML file that describes your tile server configuration, use these tips:
nameis required. This label for the tile server appears in the dropdown menu of tile servers from which to choose. See the following animated screenshot to observe the action of choosing a preconfigured tile server from the dropdown menu.urlTemplateURI should include all of the variables for the coordinates to specify the zoom and x,y location or tile location.- You can specify options that are specific to the tile server, such as a minimum and maximum zoom or the tile matrix set.
In this example, the first urlTemplate uses the OSM (OpenStreetMap) tile server format. If you are configuring a tile server that uses the Web Map Tile Service (WMTS) protocol instead, specify "wmts": true and provide a URI that conforms to that protocol, as shown in the second urlTemplate.
TAMR_TILE_SERVERS: |
    [
      {
        "name": "openstreetmap_example",
        "urlTemplate": "https://{s}.tile.serverName.org/{z}/{x}/{y}.png",
        "options": {
          "minZoom": 0,
          "maxZoom": 18
        }
      },
      {
        "name": "wmts_example",
        "urlTemplate": "https://tile.serverName.com/{tileMatrixSet}/{tileMatrix}/{tileCol}/{tileRow}.png",
        "wmts": true,
        "options": {
          "tilematrixSet": "GLOBAL_WEBMERCATOR"
        }
      }
    ]
Selecting a Tile Server
After you add multiple tile servers to your YAML file, users can select the server to use for the map to display geospatial records in a mastering project. You can switch between tile servers.
To select a tile server for the map:
- On the Record details side panel, choose the tile server icon.
- Select the tile server from the dropdown menu.
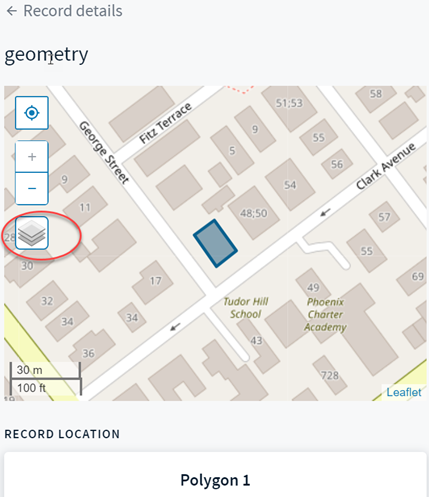
Use the tile server icon to select the tile server for the map.
The following animated screenshot illustrates how to select a tile server from the dropdown menu on the Pair details right-side panel.
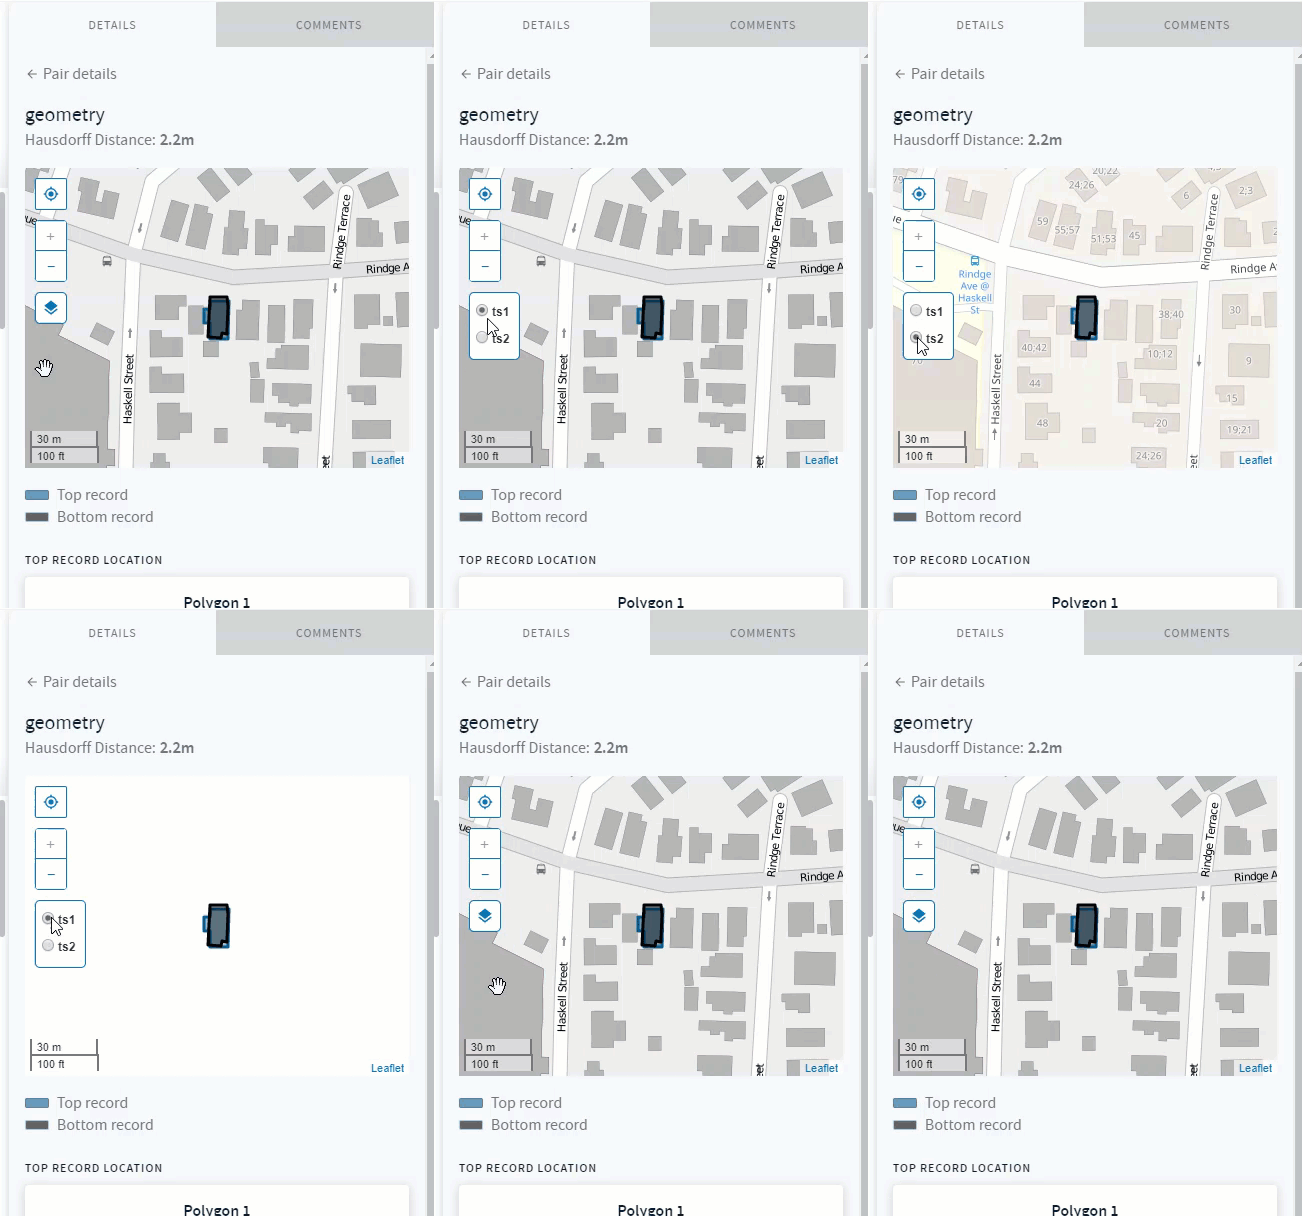
Choose a tile server on the Pair details side panel.
Working with Pairs and Clusters of Geospatial Records
After you configure map tiles, you can explore groups of geospatial records on the Pairs and Clusters pages of a mastering project.
To view pair details:
- On the Pairs page, select a pair of geospatial records.
- To display the Pair details side panel for these records with the map, select the blue link in the geospatial attribute's column on the selected pair. In the screenshot, the geospatial attribute's column is titled "geometry". The records display in the Pair details side panel on the map that is powered by the tile server you have configured. Colors distinguish two different records.
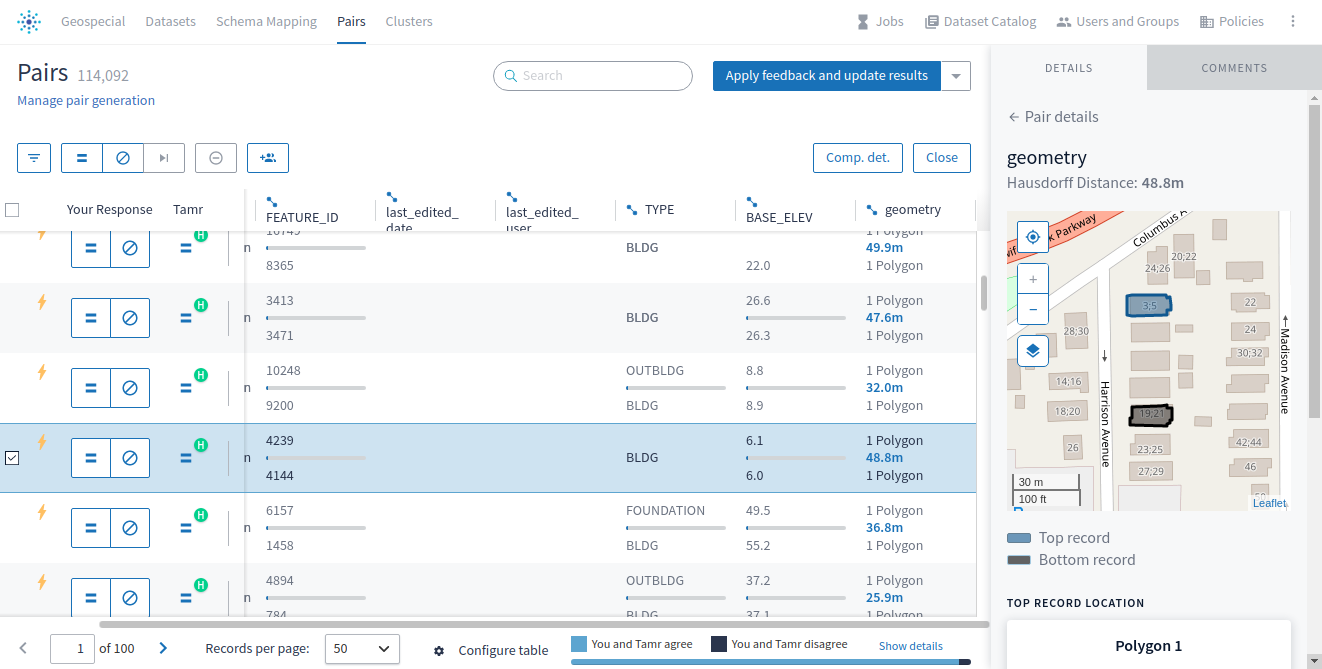
The Pair details side panel on the Pairs page shows two geospatial records on the map.
The following screenshot shows two clusters of geospatial data on a single screen on the Clusters page.
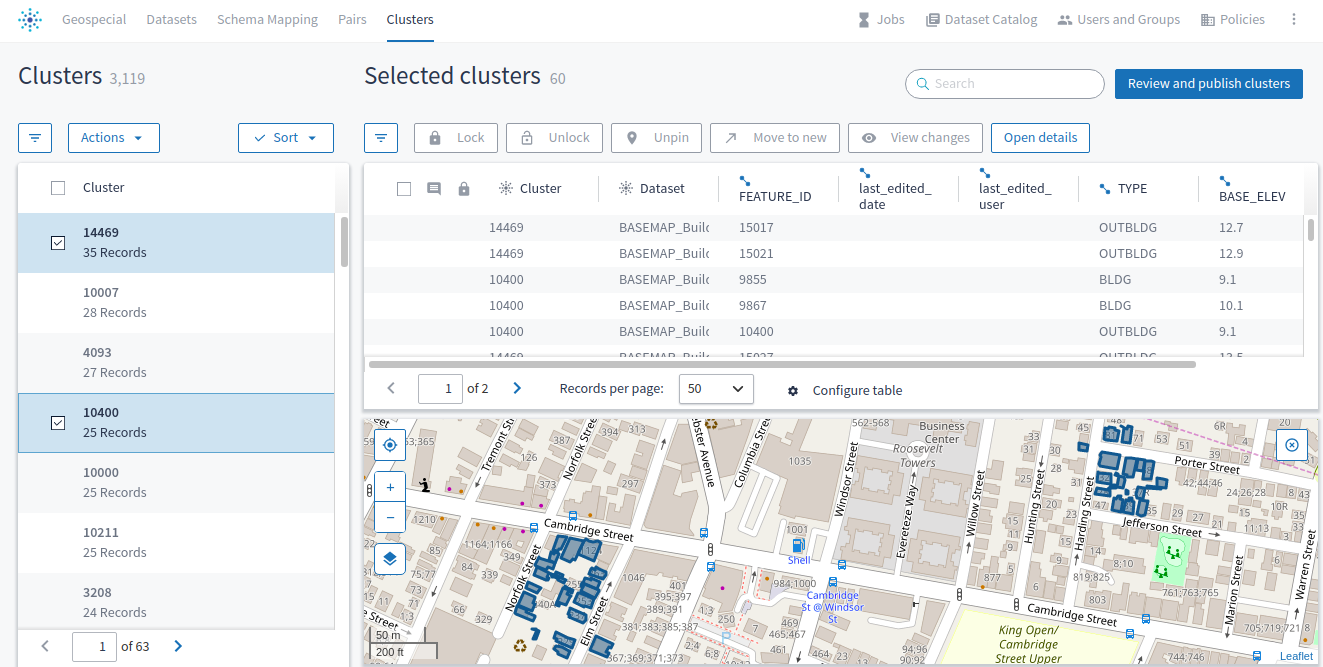
The Clusters page shows two clusters of geospatial records.
The following screenshot shows a cluster view of records. In addition, you can use the side panel to view a single geospatial record. In this example, the main screen and the side panel rely on different tile servers.
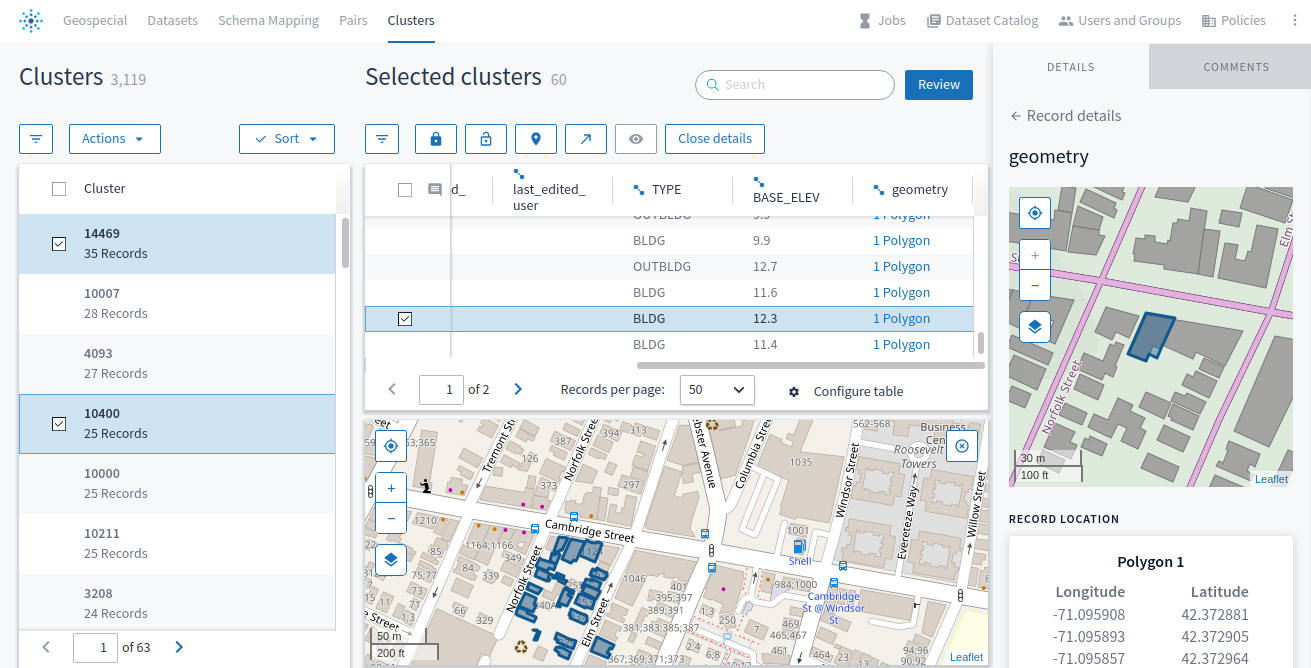
A cluster view of records with two different tile servers used for the main page and the Record details side panel.
You can indicate whether the project displays adjacent records. The following screenshot shows:
- The control to display the map.
- The toggle to show records that are adjacent to the selected cluster of geospatial records.
- The informational message about the limit of displaying up to one thousand clusters, when zooming out.
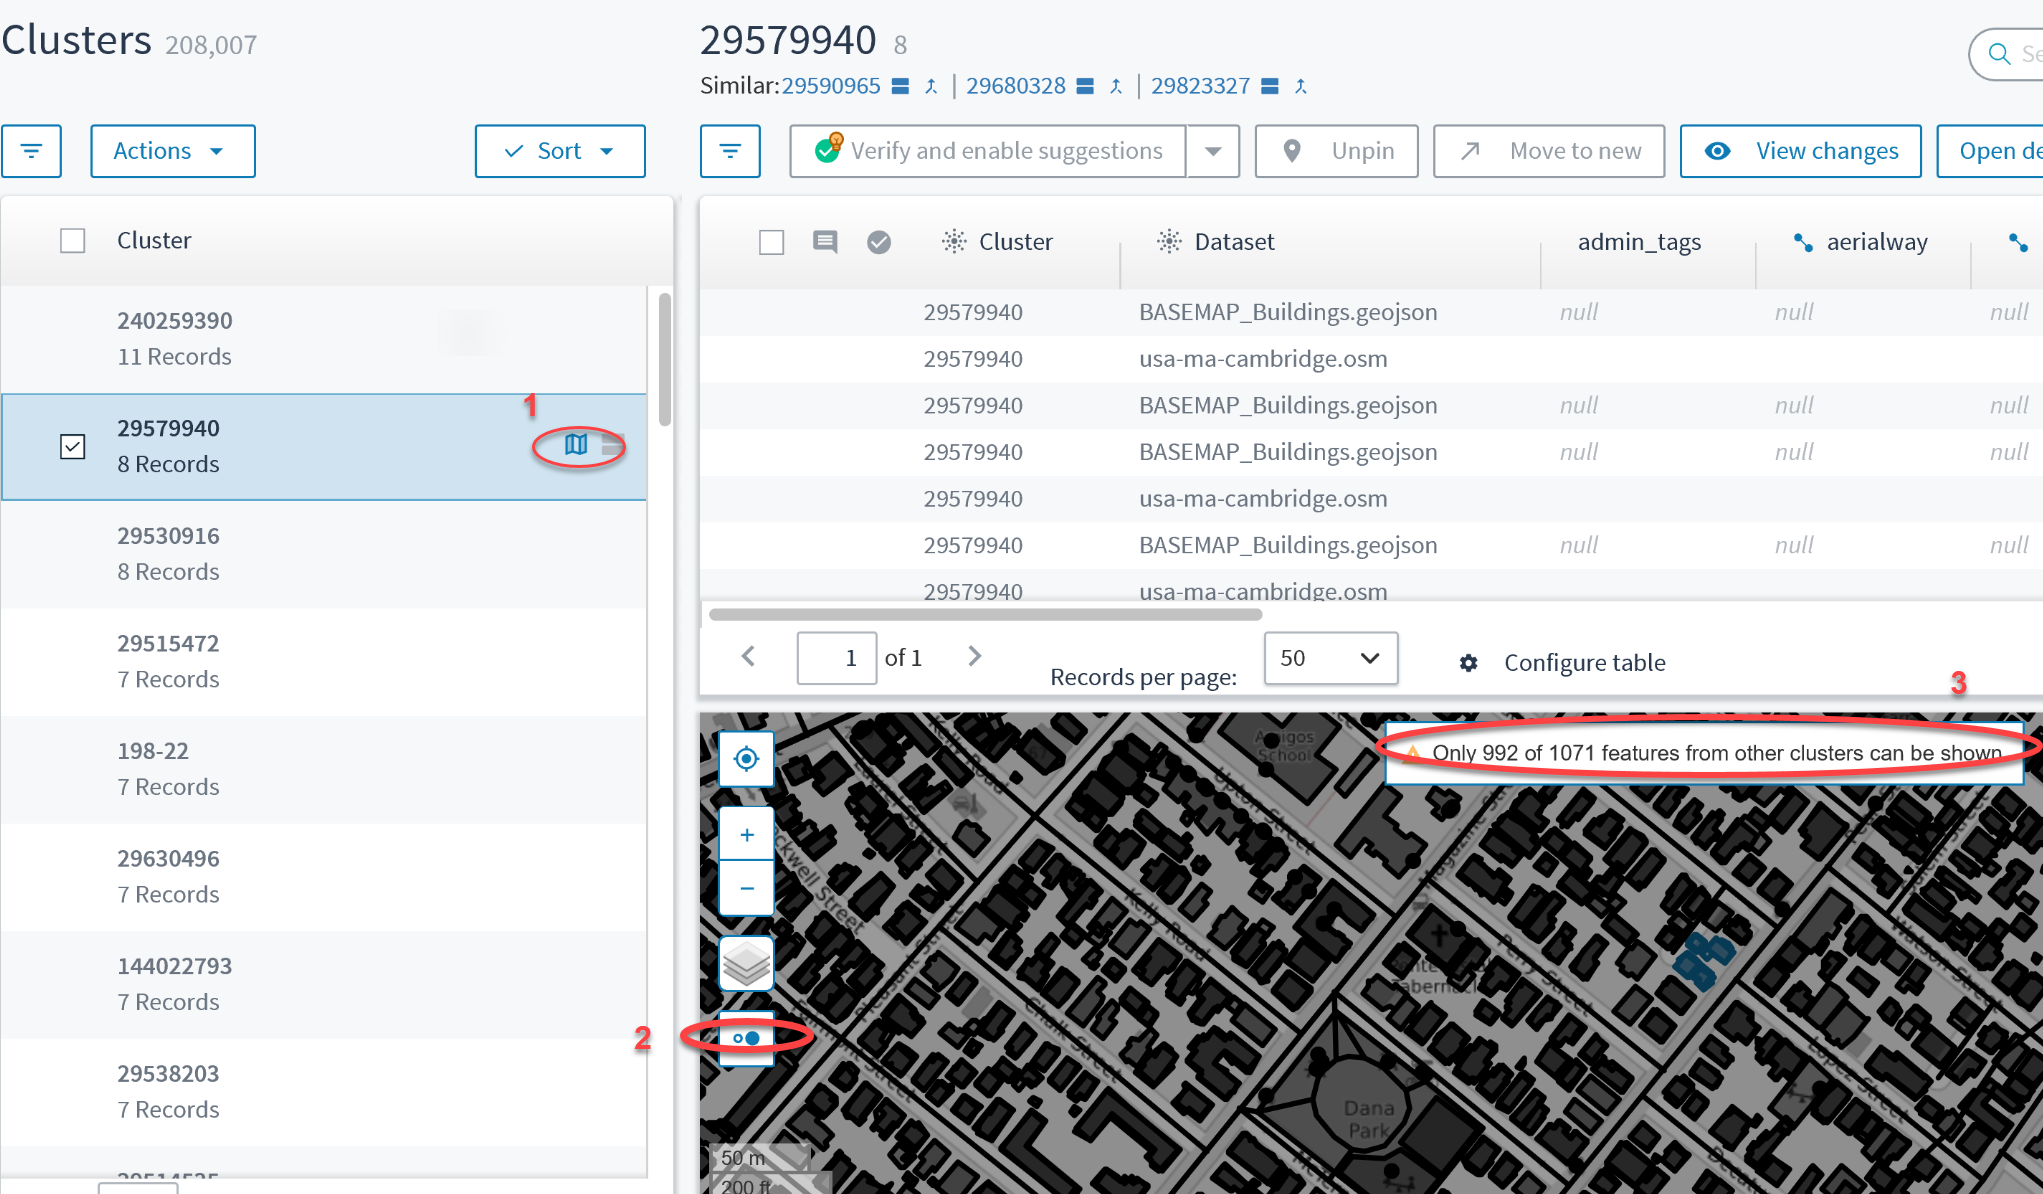
Callouts show the icon to choose to display the map, the toggle to show adjacent records, and the informational message about the limit for the number of clusters.
The following screenshot shows a cluster of records along with adjacent records. This means you have chosen to display adjacent clusters. Adjacent records that are not part of the cluster are shown in black font.
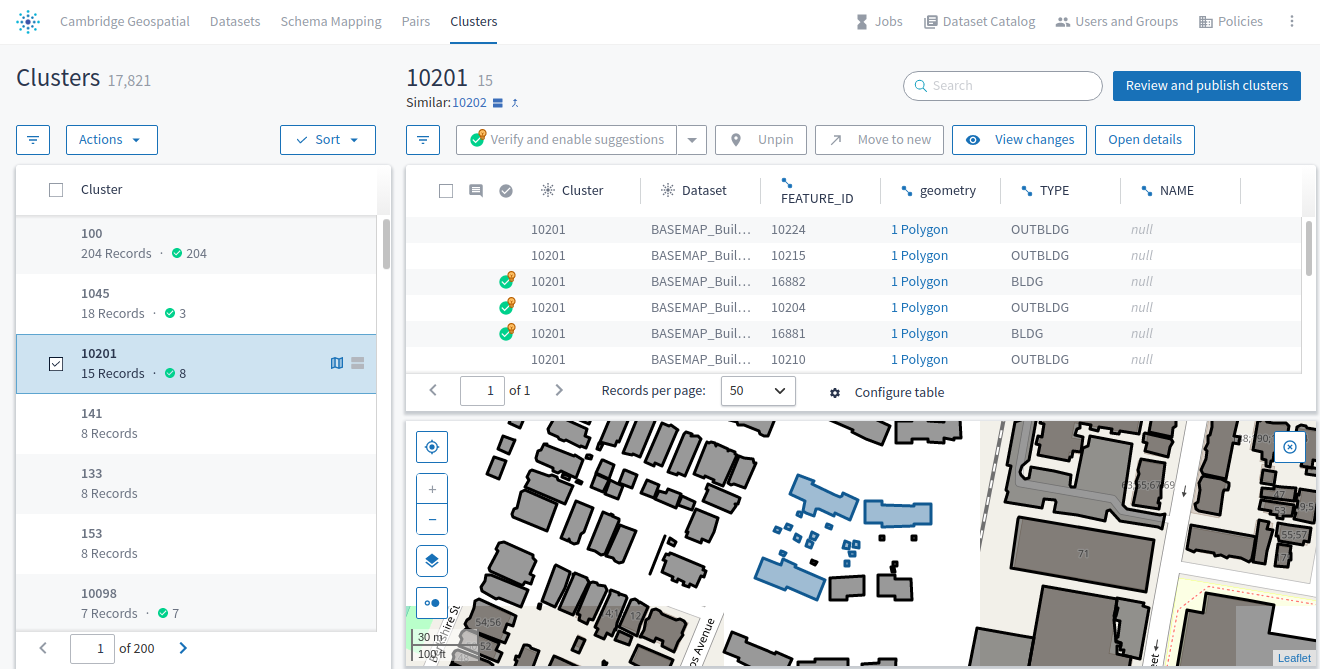
The cluster of records is shown in blue, whereas the adjacent records display in black.
Troubleshooting Tips
Use these tips when working with geospatial records:
- The attribute of type geospatial must be configured as such, using the Geospatial Attribute toggle. If the attribute is not one of the geospatial types, the
No geometry features specifiederror message displays in place of the map. - If you marked more than one attribute as geospatial, the map displays for the first attribute by default.
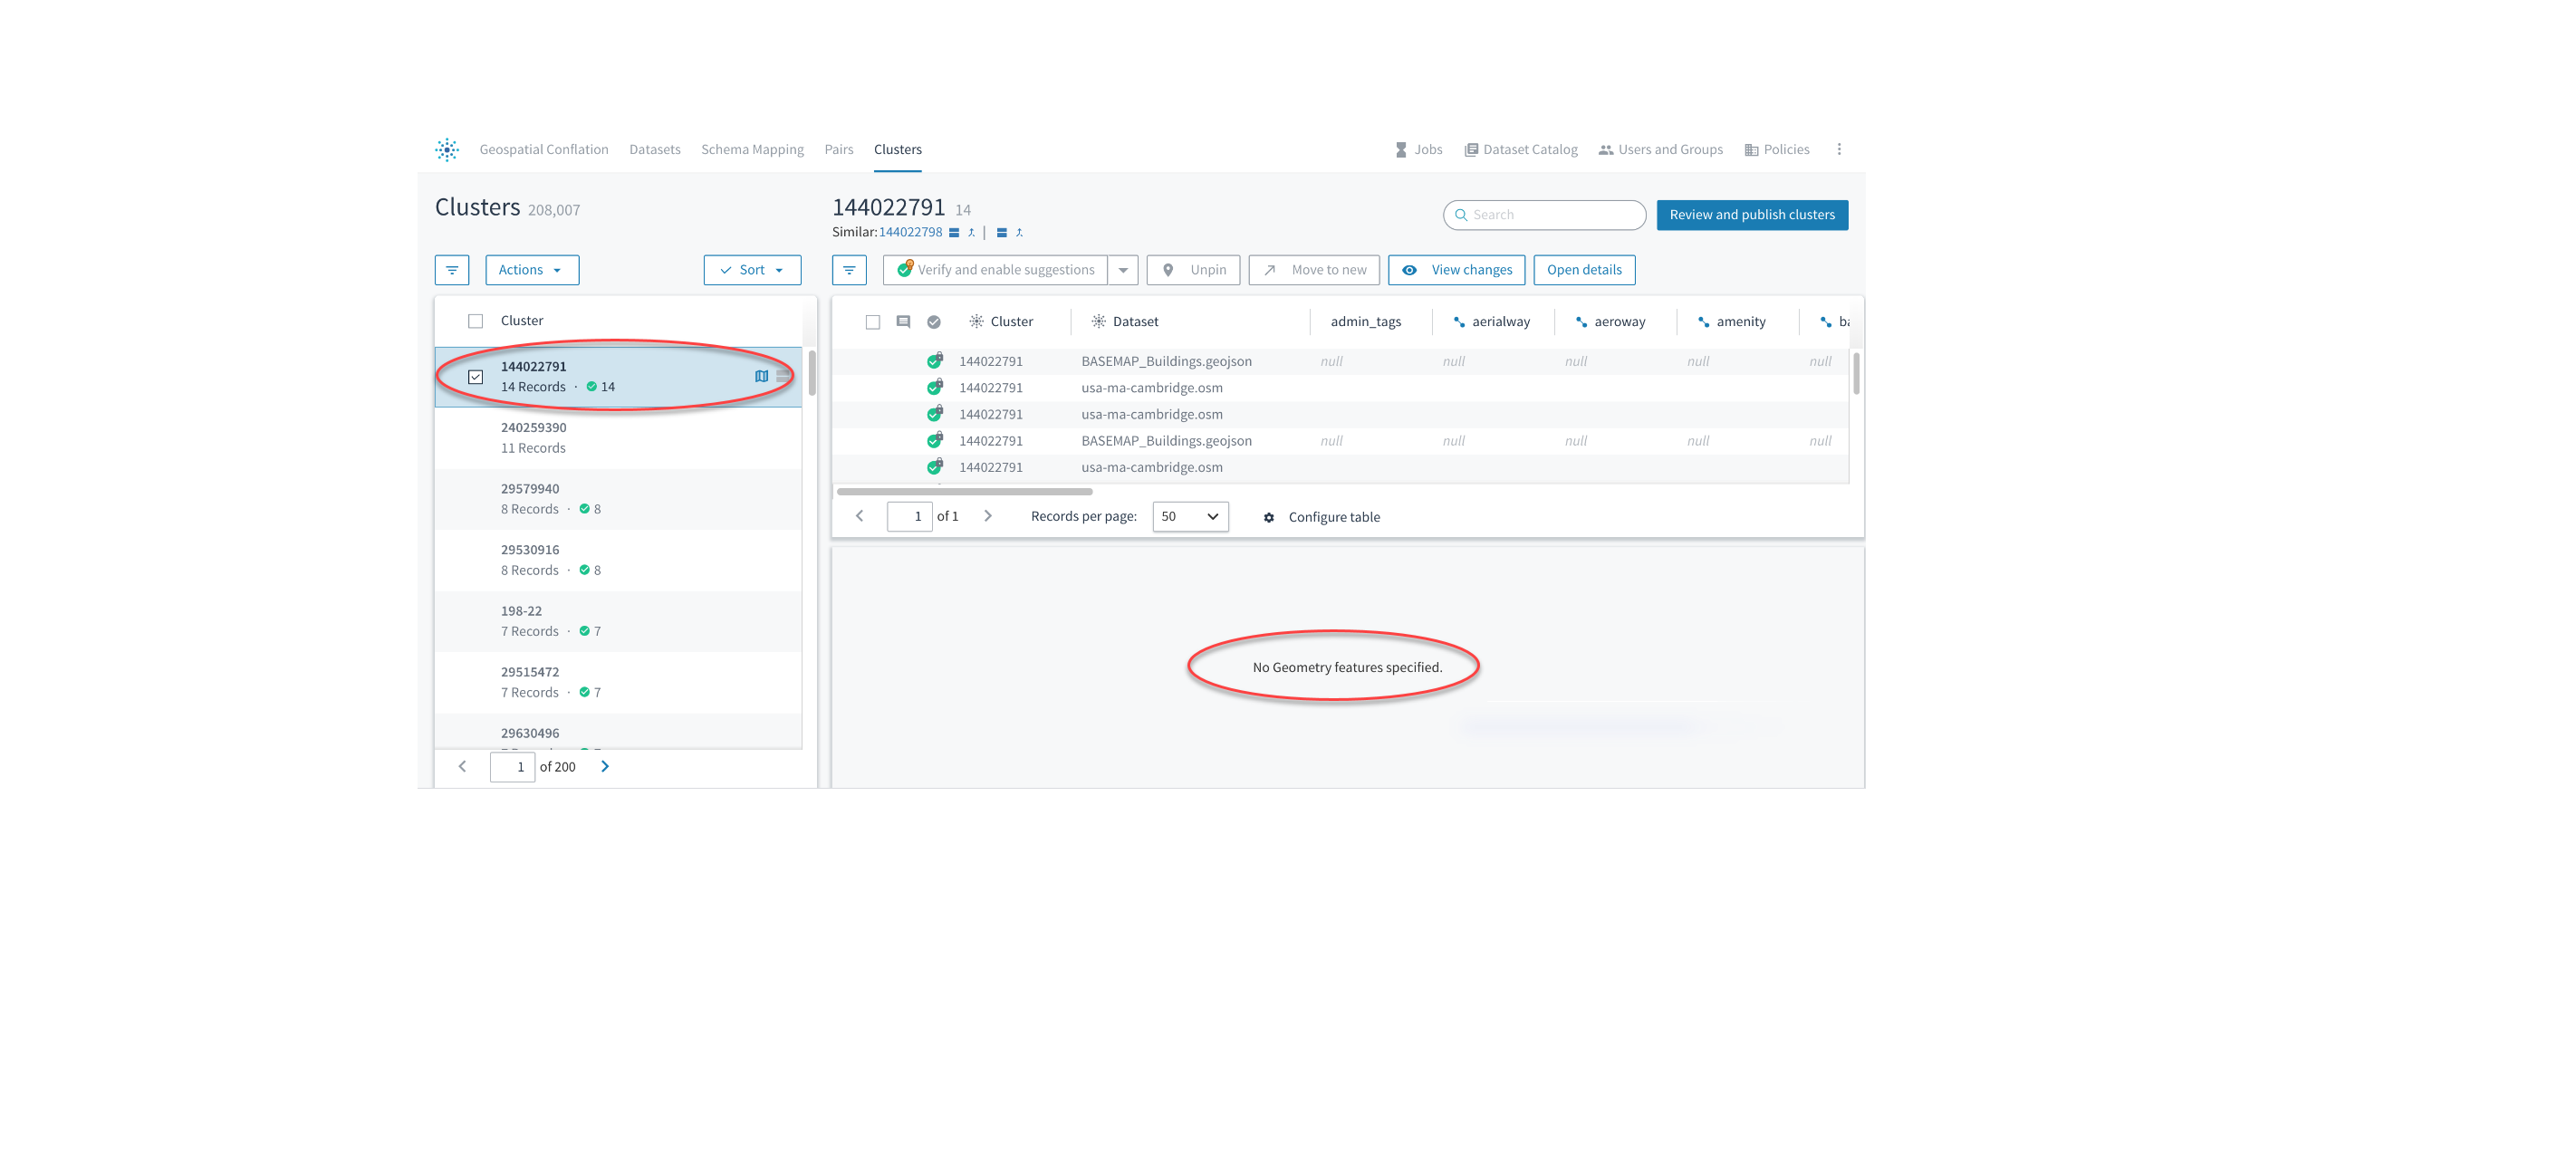
If a cluster or a pair of records does not have geospatial attributes, an error message displays instead of the map.
Known Limitations on Geospatial Features
- Features for working with geospatial data are currently available for testing only.
- To view all current known issues and limitations, see the Tamr Core Help Center.
Updated about 2 years ago