How to Check Health Status of Tamr
You can check the Tamr health status on the Swagger docs or on the terminal.
On the Swagger docs, access the link <hostname:9100/docs> from the browser, go to “unify” tab, and find the following API call:

From terminal, use the following command:
curl localhost:9100/api/service/health
The output looks like this if all the micro-services are healthy:
{
  "/api/dataset": {
    "healthy": true,
    "timestamp": "2021-02-22T12:48:30.121Z"
  },
  "/api/dedup": {
    "healthy": true,
    "timestamp": "2021-02-22T12:48:30.595Z"
  },
  "/api/preview": {
    "healthy": true,
    "timestamp": "2021-02-22T12:48:30.608Z"
  },
  "/api/pubapi": {
    "healthy": true,
    "timestamp": "2021-02-22T12:48:30.624Z"
  },
  "/api/recipe": {
    "healthy": true,
    "timestamp": "2021-02-22T12:48:30.377Z"
  },
  "/api/taxonomy": {
    "healthy": true,
    "timestamp": "2021-02-22T12:48:30.282Z"
  },
  "/api/transform": {
    "healthy": true,
    "timestamp": "2021-02-22T12:48:30.501Z"
  },
  "/api/user": {
    "healthy": true,
    "timestamp": "2021-02-22T12:48:30.512Z"
  },
  "/api/versioned": {
    "healthy": true,
    "timestamp": "2021-02-22T12:48:30.332Z"
  },
  "EsRefreshDebouncer.ConsumerDebouncer": {
    "healthy": true,
    "message": "last invocation succeeded",
    "timestamp": "2021-02-22T12:48:29.896Z"
  },
  "UnifyElasticSearchDataCluster": {
    "healthy": true,
    "message": "Cluster Status: GREEN",
    "timestamp": "2021-02-22T12:48:30.183Z"
  },
  "Zookeeper": {
    "healthy": true,
    "timestamp": "2021-02-22T12:48:30.501Z"
  },
  "dataDirectory": {
    "healthy": true,
    "timestamp": "2021-02-22T12:48:30.283Z"
  },
  "deadlocks": {
    "healthy": true,
    "timestamp": "2021-02-22T12:48:30.611Z"
  },
  "hadoopNameNode": {
    "healthy": true,
    "timestamp": "2021-02-22T12:48:30.283Z"
  },
  "persistence": {
    "healthy": true,
    "timestamp": "2021-02-22T12:48:30.524Z"
  },
  "procurify-jobs-poller": {
    "healthy": true,
    "message": "last invocation succeeded",
    "timestamp": "2021-02-22T12:48:29.936Z"
  }
}
If any microservice is unhealthy, the value false is assigned to the healthy variable as shown below. In this case, Dedup is not healthy because Elasticsearch is not healthy. This indicates that the Elasticsearch cluster is down.
{"/api/dataset":{"healthy":true,"timestamp":"2021-02-22T12:51:32.907Z"},"/api/dedup":{"healthy":false,"message":"Service is not healthy, unhealthy checks: {ElasticSearchCluster={healthy=false, message=java.net.ConnectException: Connection refused, error={cause={cause={stackTrace=[{methodName=checkConnect, fileName=SocketChannelImpl.java, lineNumber=-2, className=sun.nio.ch.SocketChannelImpl, nativeMethod=true}, {methodName=finishConnect, fileName=SocketChannelImpl.java, lineNumber=717, className=sun.nio.ch.SocketChannelImpl, nativeMethod=false}, {methodName=processEvent, fileName=DefaultConnectingIOReactor.java, lineNumber=171, className=org.apache.http.impl.nio.reactor.DefaultConnectingIOReactor, nativeMethod=false}, {methodName=processEvents, fileName=DefaultConnectingIOReactor.java, lineNumber=145, className=org.apache.http.impl.nio.reactor.DefaultConnectingIOReactor, nativeMethod=false}, {methodName=execute, fileName=AbstractMultiworkerIOReactor.java, lineNumber=348, className=org.apache.http.impl.nio.reactor.AbstractMultiworkerIOReactor, nativeMethod=false}, {methodName=execute, fileName=PoolingNHttpClientConnectionManager.java, lineNumber=192, className=org.apache.http.impl.nio.conn.PoolingNHttpClientConnectionManager, nativeMethod=false}, {methodName=run, fileName=CloseableHttpAsyncClientBase.java, lineNumber=64, className=org.apache.http.impl.nio.client.CloseableHttpAsyncClientBase$1, nativeMethod=false}, {methodName=run, fileName=Thread.java, lineNumber=748, className=java.lang.Thread, nativeMethod=false}], message=Connection refused, localizedMessage=Connection refused, suppressed=[]}, stackTrace=[{methodName=get, fileName=RestClient.java, lineNumber=959, className=org.elasticsearch.client.RestClient$SyncResponseListener, nativeMethod=false}, {methodName=performRequest, fileName=RestClient.java, lineNumber=233, className=org.elasticsearch.client.RestClient, nativeMethod=false},
If an underlying service is the cause of Tamr being unhealthy you can execute the following health checks to get more information from each dependency.
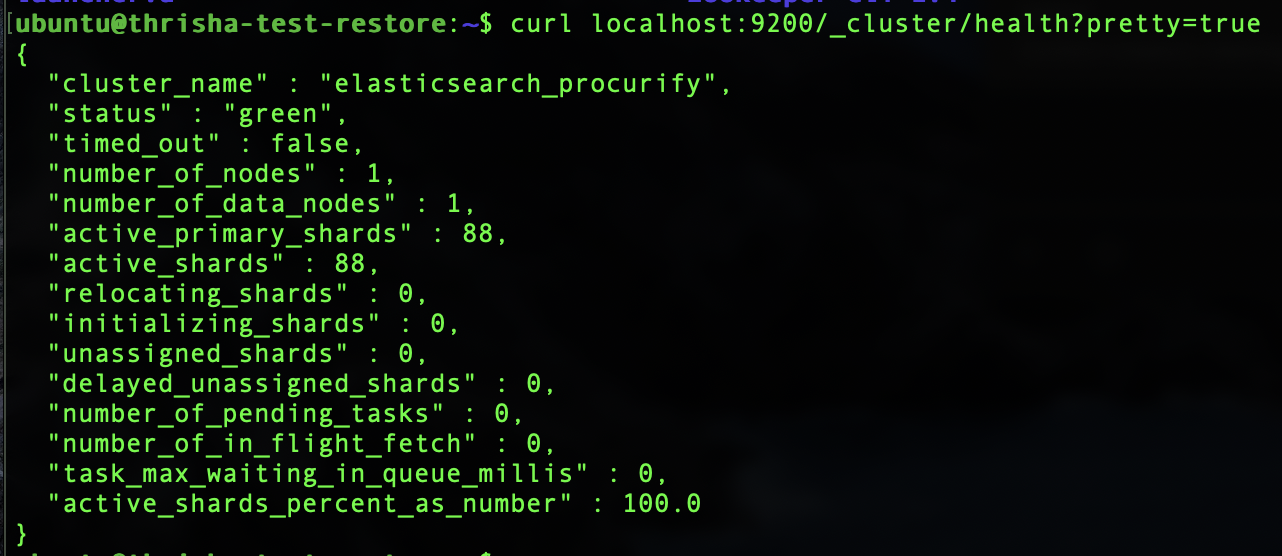
Elasticsearch
curl localhost:9200/_cluster/health?pretty=true

Postgres
/etc/init.d/postgresql status
Or
systemctl status postgresql

HBase
If port 16010 is opened, access the HBase UI http://:16010
Zookeeper
On terminal, go to <TAMR_HOME>/zookeeper-3.4.14/bin directory and execute the command as shown in the screenshot:

If Tamr itself is unhealthy but all of its dependencies are healthy, it is useful to check the server environment for any problems. To do this run the following validation command:
${TAMR_HOME}/tamr/utils/unify-admin.sh validate
Please note that the validate parameter works on versions equal to or greater than v2020.003.
Sometimes, though Tamr is healthy and validation command returns no errors, the Tamr UI is still not accessible. If you have Nginx set up, check if the Nginx is ON:
Nginx
1.

2. If the above command doesn't work, try the commands:
sudo systemctl status nginx #command to check status of nginx
sudo systemctl restart nginx.service #command to restart nginx
Updated over 2 years ago